Table of Contents
Usage
This chapter will introduce to the usage of the applet.
Screenshots
main window
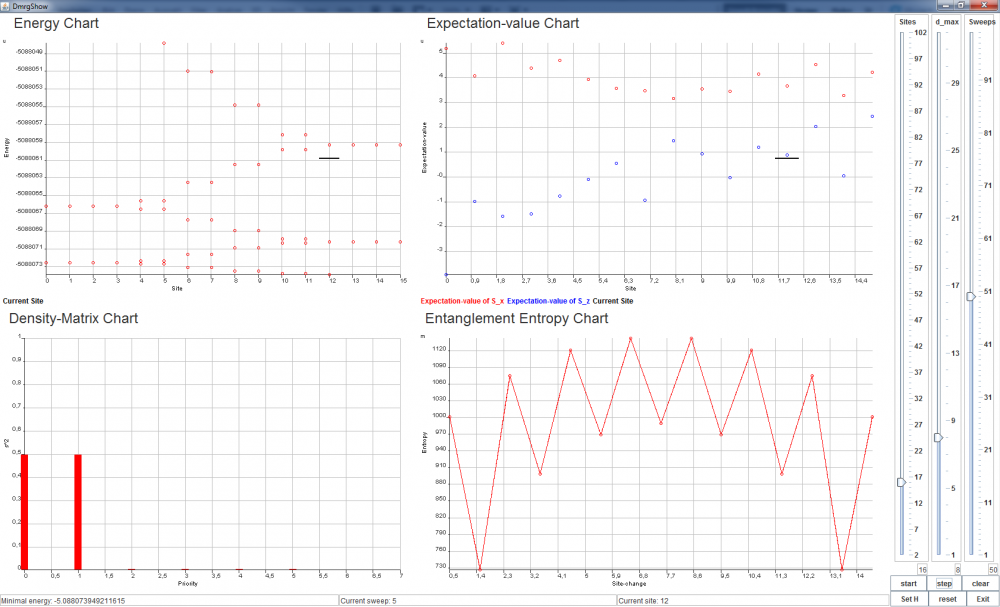
The main window consists of four plots. These give the value of the groundstate energy, the expectation values for \(S^x\) and \(S^z\), the values of the density matrix and the entanglement entropy. The jchart-2d-library offers many options for the charts. Please have a look at the related documentation 1). The energy chart and the expectation value chart show additionally to short black lines indictating the current site that is optimized. The (current) groundstate energy can be read from the lower window border.
On the right hand side of the applet you can find the controll options for the applet. Here you can adjust the
- Length of the chain
- the maximal size of the MPS-matrices
- the maximal sweep number
The value can also be read off below the slider. Below the sliders you find six buttons:
- Start/stop of the simulation
- Step - Do a single step
- Clear - Clear all the diagramms
- Set H - Opens a new window to set the Hamiltonian
- Reset - Reset the current calculation
- exit - Exit the applet (if used outside of a browser)
Hamilton-Operator-Options
After having pressed the button Set H one will find a new window for setting the Hamiltonian. Here you can choose to use the operators \(S^+\) und \(S^-\) or the operators \(S^x\) und \(S^y\). The you can set the coupling constants:
\begin{equation*} H=\frac{J}{2} (S^+S^- + S^-S^+)+J^z S^zS^z+h^zS^z+h^xS^x \end{equation*} or \begin{equation*} H=J^xS^xS^x + J^yS^yS^y+J^z S^zS^z+h^zS^z+h^xS^x \end{equation*}
©: This site was created by Piet Dargel and Thomas Köhler


